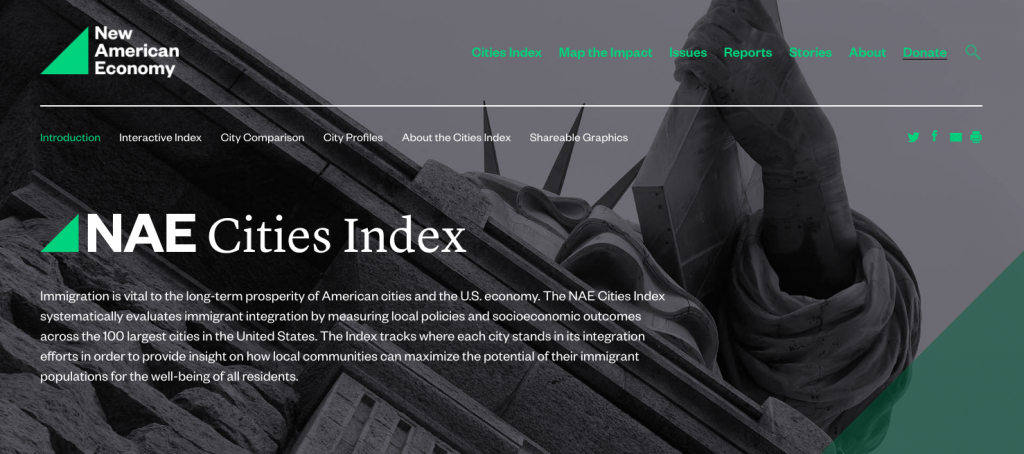
Which American city is best at incorporating immigrants? There’s a short list of places that typically come to mind. New York City. Chicago. San Francisco. In major cities, dubbed “continuous immigrant gateways” by the Brookings Institution, hundreds of nationalities and languages are represented. So, the findings of a new index of the largest 100 U.S. cities—looking at 51 different measures of immigrant inclusion—might be surprising: in the 2018 NAE Cities Index, Newark, NJ took the top spot, followed by Baltimore, MD.
It’s not that the traditional immigrant gateways didn’t perform well: New York, Chicago, and San Francisco all ranked within the top 10 cities overall, and they each earned near-perfect marks in the policy section. But in the NAE Cities Index, policy accounts for just half of the total score. For the first time, researchers also looked at 21 different socioeconomic outcomes to see how well immigrants are doing in comparison to the U.S.-born in their respective communities.
As cities develop new practices to integrate immigrants into civic and economic life, it’s important to understand whether such efforts are achieving their stated objectives. That means, for example, surveying cities to identify programs that support immigrant entrepreneurs, and also looking at Census data to see whether immigrants are closing the gap in terms of business ownership rates and income. It means identifying professional licensing policies and vocational training programs, and then examining disparities in labor force participation, employment rates, and access to high-prestige occupations. It means looking beyond the impressive economic contributions immigrants make to find out whether they have the same access to job opportunities, housing, education, and health insurance coverage as their peers.
Taking just the first year of NAE Cities Index data into account, there are already some interesting findings. First, the 25 highest-scoring cities in the Index are attracting larger shares of highly skilled immigrants and U.S.-born residents than their peers, making them more competitive for business and economic investment. In the top 25 cities, on average, the share of immigrant advanced degree holders (15.9%) and U.S.-born advanced degree holders (14.5%) is higher than in cities in the Index overall (12.8% and 12.9%, respectively).
 The top cities also benefit from greater equity between immigrants and the U.S.-born across key measures of quality of life. In terms of homeownership rates, health insurance rates, and poverty rates, there are smaller gaps between the U.S.-born and immigrants in the top 25 Index cities than in cities overall. U.S.-born and immigrant residents of the top 25 cities also have higher overall health insurance rates (90.1% and 75.8%, respectively) compared with their counterparts in cities overall (89.0% and 70.2%, respectively).
There are also limitations to what this kind of index can currently show. With just one year of data on the books, it’s not yet possible to evaluate investments in immigrant inclusion over time. Updating the NAE Cities Index annually will offer a clearer picture of the relationship between policy and socioeconomic outcomes, which may lead to more evidence-based recommendations for local governments. Other similar assessment efforts build in additional helpful components. For example, a new diagnostic tool from Cities of Migration surveys attitudes and perceptions about inclusion from locals. Whether newcomers or long-term residents perceive their communities to be welcoming is important feedback for local governments as well as businesses seeking to invest in places that are attractive to talent. Among other components, the Certified Welcoming program from Welcoming America combines a self-assessment with a detailed site visit and roadmap to support key areas for growth. A long-standing inclusion index from the Human Rights Campaign, the Municipal Equality Index, provides cities detailed scorecards to identify clearly where they are succeeding or falling short.
For business and community leaders seeking to develop similar tools, these existing resources provide some important lessons:
- First, it is important to consult both experts as well as municipal governments (or the entity being assessed) in the process. Certain policies may fall outside the jurisdiction of local governments and should be weighted appropriately.
- Second, adding in a component that goes beyond policy alone—whether that includes socioeconomic outcome data, surveys of attitudes, or other measures—can help provide a clearer picture of what’s happening on the ground.
- Finally, updating the resource regularly offers an opportunity to track progress over time, and also to adapt the tool within a changing policy and political landscape.
Thanks to strong local leadership—as well as the efforts of organizations like Welcoming America, Cities for Citizenship, Cities for Action, and many others—local efforts to promote diversity and inclusion have scaled up significantly over the past decade. Their proliferation shows that local governments understand that welcoming newcomers, if done the right way, can be beneficial for all residents. But this rapid expansion of integration practices also creates a need for new research into what actually works. Indexes can shine a light on promising approaches that might have otherwise flown under the radar, and challenge conventional wisdom in the process.
